
Class diagrams are important tools for visualizing and designing systems. Rather than documenting your data and systems with text alone, class diagrams help programmers and their teams more easily model and understand how their applications are structured and how objects within those systems relate to one another.
In this article, we’ll cover the basics of UML class diagrams, including what they are, why you should use them, and how to create your own.
Class diagrams are static structure diagrams that visualize and model object-oriented systems.
In object-oriented programming (OOP), a class is a template or blueprint that is used to create some kind of object. When a bunch of objects have the same structure or common behaviors, you can assign them to a class. The class can then be used to create any number of objects that share the same structure and behaviors.
For example, you might have a class called UserAccount that you use to create a user account object for your website. This class might include a set of attributes that all user account objects created from it must have, such as first and last name, email address, phone number, birth date, etc. While the structure and attributes are the same for each object, the values for each attribute field will be different and make each user account object unique.
It’s sort of like owning a car. You buy a specific make and model with the features that you want. These cars are mass-produced in factories using a specific blueprint, or class, that specifies the structure and standard features. This means there are probably thousands of cars just like yours on the road. They are all objects created from the same class. They share the same structure, features, and behaviors but might vary in little things such as exterior and interior colors.
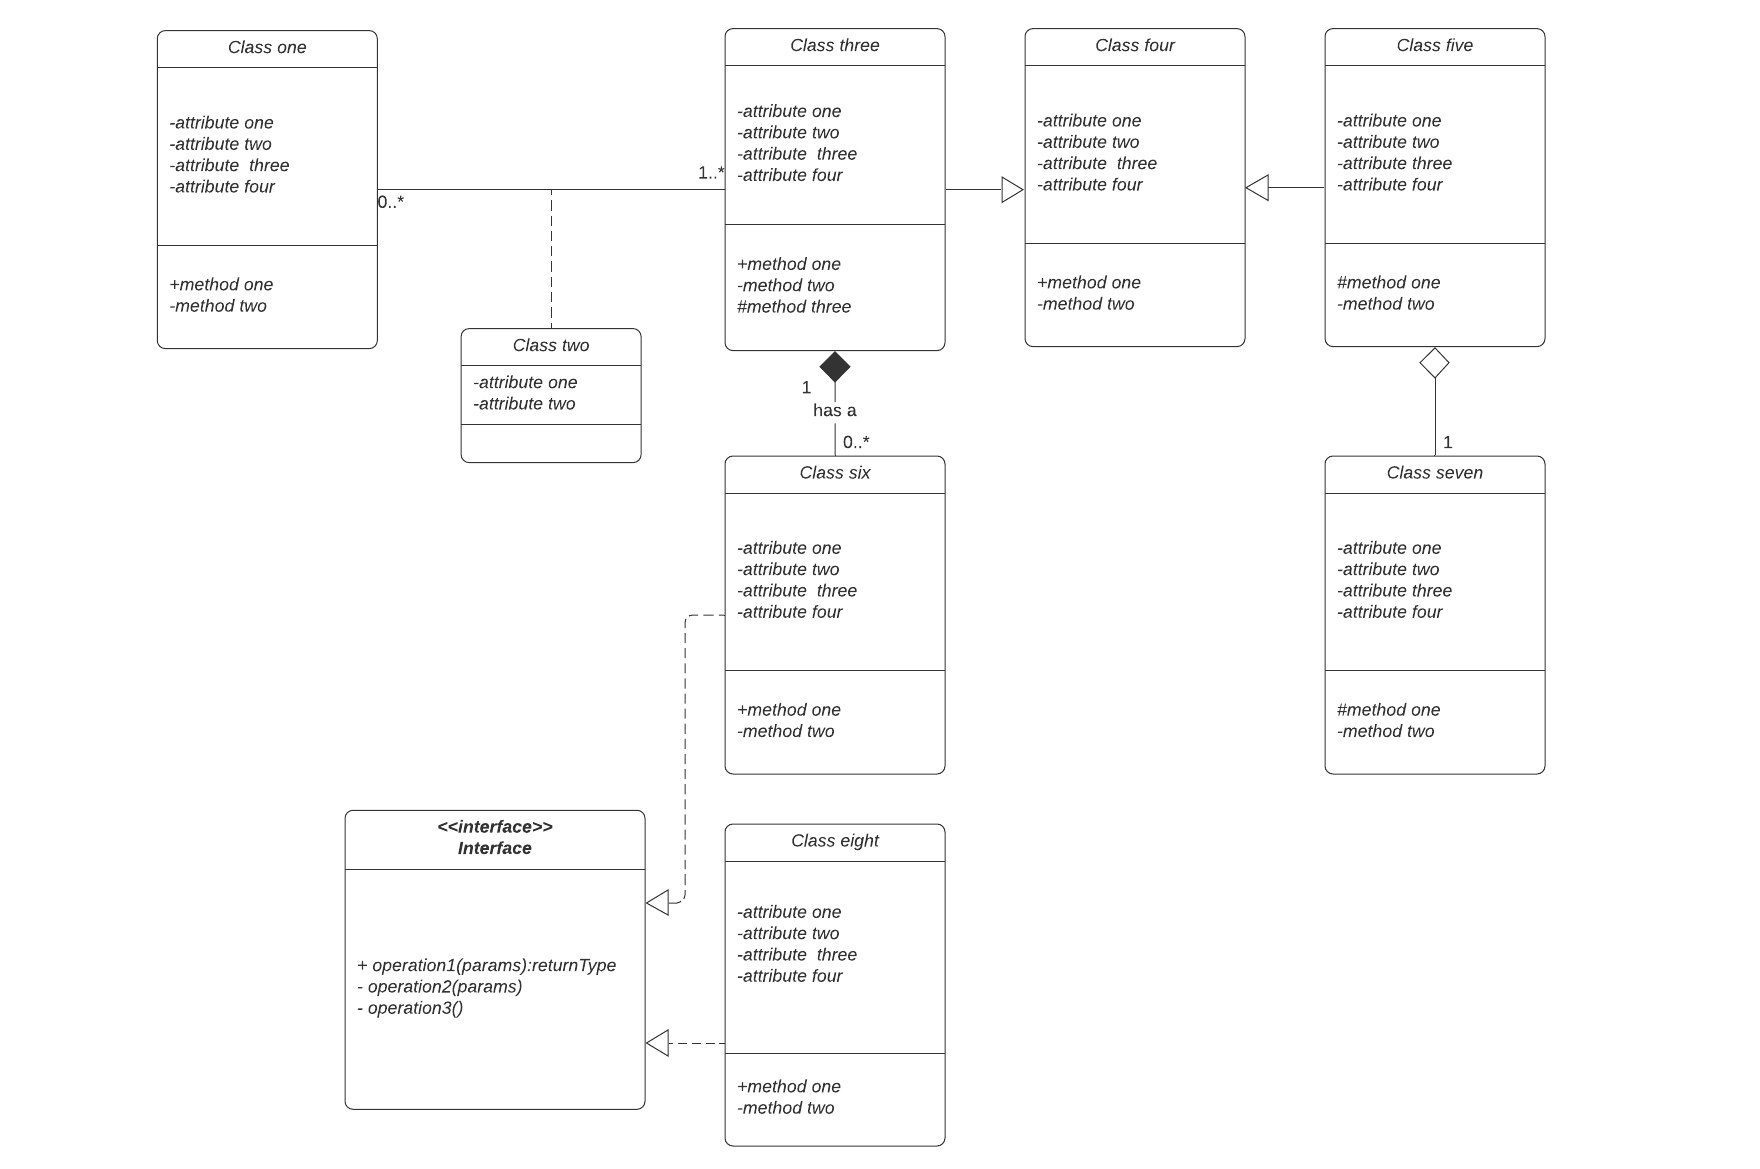
So a class diagram is simply a visual representation of classes you’ve defined. The diagrams describe class structure, attributes, specifications, and behaviors, as well as the relationships among various classes. They help you to visualize and understand different aspects of complex software systems.
Class diagrams are created using Unified Modeling Language (UML). UML is a common, standardized graphical language that lets you visualize software systems. It is used in OOP to help developers to create consistent, structured architecture. The UML notation includes a library of integrated diagrams that you can use to represent the objects and processes that make up a piece of software or software systems.
A class diagram is one of several different types of UML diagrams. There are two broad categories: structural UML and behavioral UML. Class diagrams fall under the structural UML category. They are static structure diagrams that you can use to describe a system’s structure.
Using UML notation, you can create a visualization that describes and documents your system’s classes, their attributes, operations (or methods), and the relationships among the objects. UML class diagrams also help developers to describe and present systems in a way that is easier for everybody involved in the project to understand.
The biggest benefit of class diagrams might be that they let you visualize systems. Presenting complex ideas in visual form is important because our brains can process images faster than other types of information.
Additionally, class diagrams are one of the main building blocks in object-oriented modeling. They are the only UML diagrams that can be mapped directly to OOP languages such as Python, Java, and C++. This makes them one of the most popular UML diagrams among software developers because they are helpful during software construction.
You should use UML class diagrams so you can:
Before you jump in and start drawing class diagrams, get familiar with UML shapes and the basic elements.
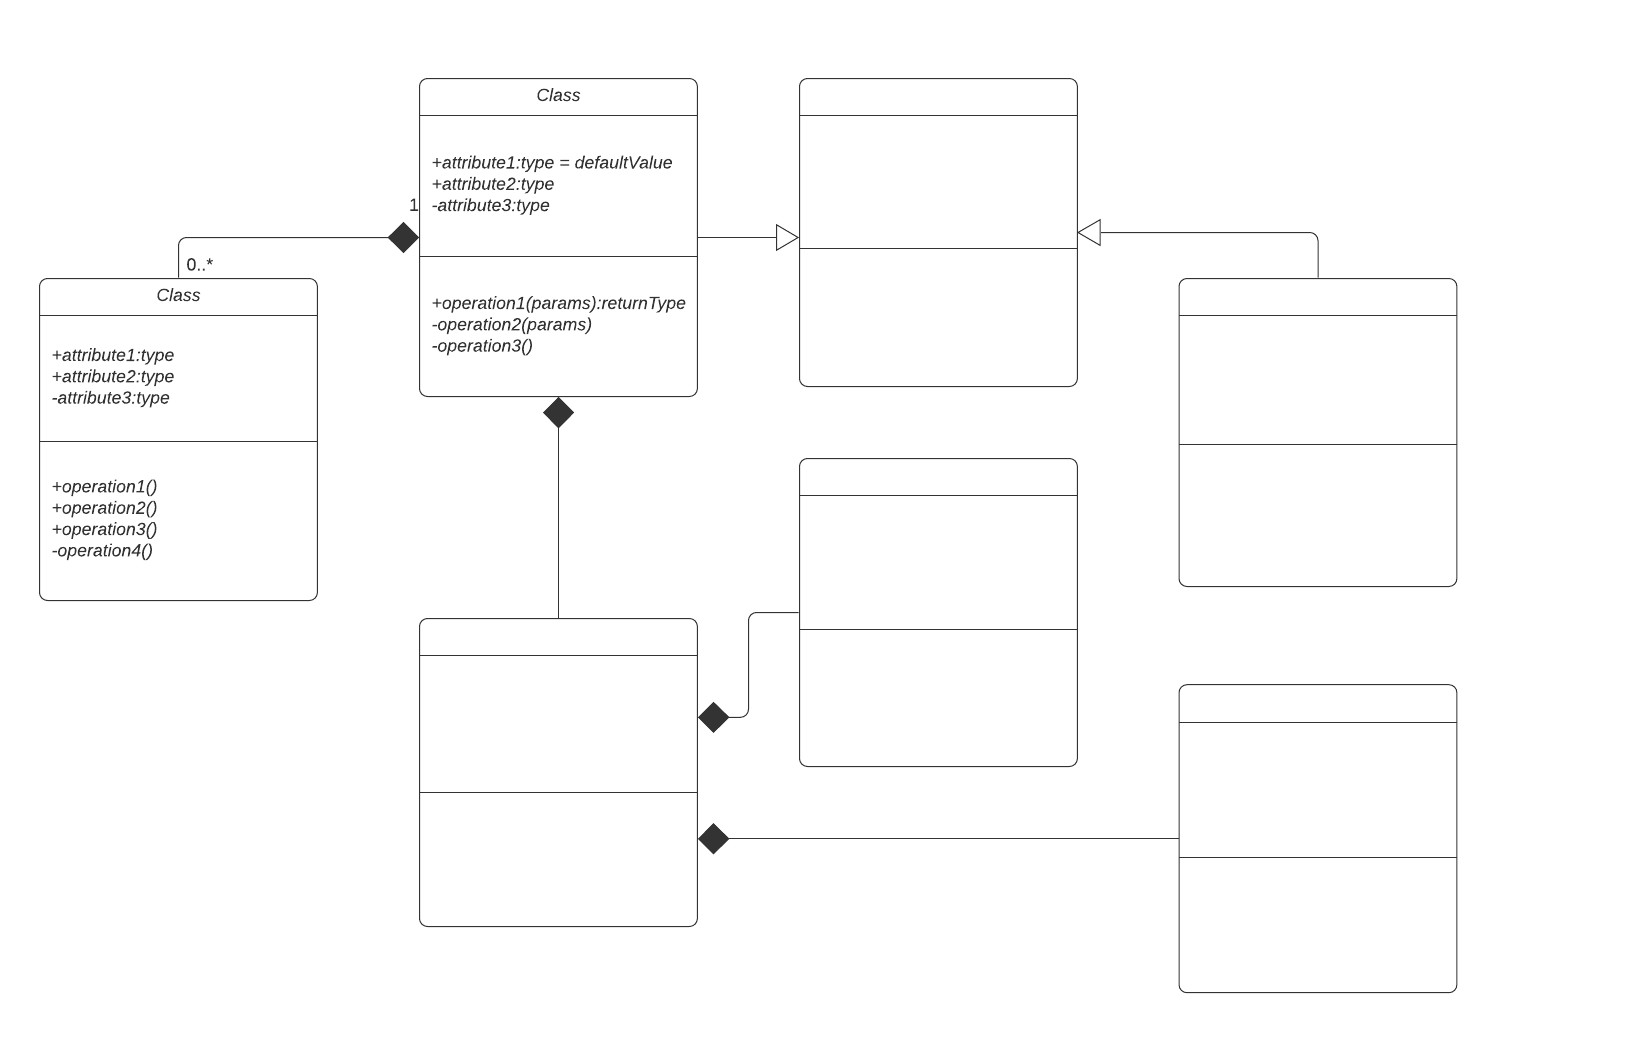
The class shape itself is a rectangle divided into three sections:
Watch this tutorial for more information about creating UML class diagrams in Lucidchart.
Here are some things to consider when drawing Lucidchart class diagrams with UML notation:
While you might be diagramming only a single class, it’s likely that it will be used in a larger system. A system is represented by a class diagram that consists of a collection of various classes that all need to work together. That’s why it’s important to identify elements in advance and understand how they relate to each other.
When several classes are grouped together in one class diagram, it helps you to understand the static structure and relationships among all of them. This can also help you to identify and fix potential problem areas before anything bad happens.
Fortunately, Lucidchart offers UML diagram templates with standardized notation shapes and connectors that can help you to start drawing class diagrams in no time. Simply enter the information in the appropriate sections to describe your class. And Lucidchart’s library of UML shapes help you to follow UML standards so that they are easy for everybody to read and understand.
In addition, your Lucidchart documents are stored in the cloud. This means you can access them at any time from any location. All team members can work on the same document at the same time in a collaborative effort.

Learn more about creating Lucidchart UML class diagrams.
Lucidchart, a cloud-based intelligent diagramming application, is a core component of Lucid Software's Visual Collaboration Suite. This intuitive, cloud-based solution empowers teams to collaborate in real-time to build flowcharts, mockups, UML diagrams, customer journey maps, and more. Lucidchart propels teams forward to build the future faster. Lucid is proud to serve top businesses around the world, including customers such as Google, GE, and NBC Universal, and 99% of the Fortune 500. Lucid partners with industry leaders, including Google, Atlassian, and Microsoft. Since its founding, Lucid has received numerous awards for its products, business, and workplace culture. For more information, visit lucidchart.com.